Tuesday, December 21, 2010

S&P500: Achieved Target Area.

The last post, "S&P500: Wave 5 underway", more than 2 weeks ago, suggested a target of 1255 in the near term. Last session, SPX hit a high of 1256. Are we about to conclude this uptrend since Jul-10? No one can know for sure. But going by the bullish sentiment (refer to last post for chart) & overbought oscillators, it would not hurt to err on the side of caution here & take some off the table, for a short-medium term trader.


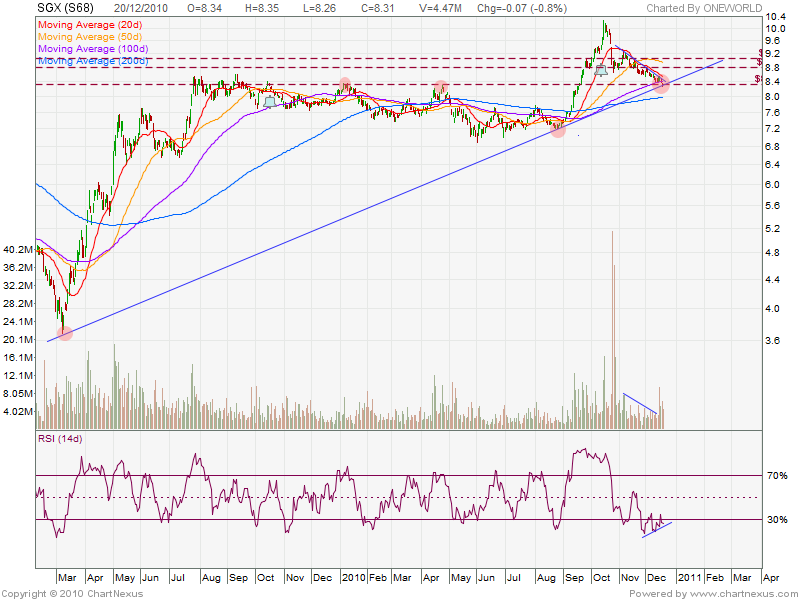
Note the slight negative divergence on the daily chart. Of course, this uptrend could continue and hit the upper line of the wedge, before it stalls. Support is at 1220 area, which was just broken out of, followed by 1175.

Monday, December 20, 2010

Singapore Exchange: Back to the drawing board!

Last post on SGX, suggested a possible bounce as long as price stayed above $8.50. It didn't, and as promised i went back to the drawing board. Here's what i found. SGX is sitting on a trendline going back to the 2009 lows, and is at an important support level around $8.30. With the STI on neckline support at 3120, this is as good a place as any for a rebound. I will wait for the break of the short-term downtrendline, before initiating a trade. Resistance levels as per last post, with $8.50 level as additional one now.


A break below the uptrendline & $8.30 level could be medium-term bearish for SGX. As always, i will have a suitable stop-loss in place. All the best!

Overall, the long-term chart of SGX doesn't suggest strength so far, which leads me to theorize that the merger may not work out eventually! Time will tell, but charts do whisper and occasionally yell. ;)

Sunday, December 19, 2010

Shanghai Composite: Testing Resistance

Since the last update, the SSEC has been barely able to squeak out some gains on low volume, and is now at stiff resistance from the very downtrendline it broke earlier. Coupled with the 2950 historical resistance, we could see a move down lower from here. Initial support around 2700, followed by 2570. On the other hand, a break above the line on decent volume is bullish, and may lead to a re-test of 3150. Based on volume cues so far, the move down seems more likely. Here's the chart:


(Edit: Although the technical reason is clear, watch out for some fundamental explanation from the news agencies to explain the fall!)

All the best!

Thursday, December 16, 2010

H&S in H&S UPDATE

Refer to my last post: "H&S in H&S?", suggesting an impending Head & Shoulders short-term top in the Hang Seng (HSI) & Straits Times (STI) Indices. Here are the updated charts.

The HSI has given up on 23600 after a bit of a struggle. Note the volume spike on the last decline. As the hourly is oversold - and we're at the neckline -, a short-term bounce is possible here. A break below the neckline on higher volume, will add strength to the H&S picture with an eventual target around below 21000.


The STI seems to be holding up better, and has not yet reached the neckline. Declining volumes are not high either. However, should this change, we're looking at an eventual target around 2900.

A break above the shoulder line will negate these scenarios. Remember, H&S patterns need not always work out. Weigh the probabilities, and place your stops accordingly.

Wednesday, December 8, 2010

Singapore Exchange: Short-term bounce ahead?

A classic case of  "Buy the Rumour, Sell the News"! After SGX went vertical, it collapsed (as all parabolic moves eventually do), and is now back at previous rally high of $8.50. Coupled with the oversold indication on the daily RSI, it is a good place for a short-term bounce towards $8.80 initially,  probably followed by $9.00 & $9.30. A sustained break below $8.50 at this stage will have us back at the drawing board!


As if by coincidence, expect some positive news flow about the SGX-ASX merger in the coming weeks! ;)

Shanghai Composite & Shenzhen Composite

Shanghai Composite has been consolidating in a narrow range on anaemic volume, after the quick drop from 3150. The 2950 level proving to be solid resistance to the upside, while a break below 2800 might see support just under 2700. Probability of a move down is higher in keeping with the short-term trend.


As for the wave count, the bullish count is hanging by a thread. A break below 2700 will be bearish, and possibly indicating a truncation.

Shenzhen Composite (SZSE)

It might be useful to look at the other Chinese Index: The Shenzhen Composite, which is painting a more bullish picture.


Although still below its' all-time highs, it has exceeded its rally highs. After a successful back-test, it is currently in a triangle consolidation. As long as it stays above 1230 level, there's more upside ahead. Depending on your stock selection (or that of your fund manager), your performance might be closer to this index.

I will be posting occasional updates on the SZSE as well in the future.

Saturday, December 4, 2010

S&P500: Wave 5 underway

Last post on the SPX called for another wave up to finish this medium-term rally. Wave 4 is most likely complete with last week's sharp rally. We are now at recent highs once again, and can expect some consolidation. A breakout above 1227 will turn it into a support level instead, and offer a near-term target of 1255. Also, lookout for the upper trendline of the wedge. I will be posting the 15-year spx chart at an opportune time in the future.


Sentiment - Reason for Caution longer-term

While the rally and recovery news fills investors with optimism, it may be prudent to take a look at the longer-term picture here. If the 2008-09 decline was impulsive (in 5 waves), - and this is the view of the folks at EWI - we're currently looking at wave C of an A-B-C style rally. This is likely to be followed by another impulsive decline to re-test the lows.


Here's the sentiment picture. Compare it with the highs of 2007, and you will see that we're not far.


All the best!

Vietnam may go Vertical.

The HO chi minh Stock Exchange (HOSE), after its euphoria rally of 2007 towards 1175, gave it all up in the next couple of years. As the world recovered in 2009, the HOSE rallied in Wave A to the 600 level from its low of 250, a 38% retrace. As seen in the chart, a lengthy triangular Wave B consolidation followed, retracing almost 50% of the rise. A medium-term bull market in Wave C might be right ahead, to retest the Wave A highs. Longer-term, the HOSE is in a bear market and is likely to re-test the lows. A sustained break below the lower support line will negate this scenario.

Friday, December 3, 2010

H&S in H&S?

Head & Shoulders in Hang Seng & Straits Times Indicies?

Last post on the Hang Seng, called for a rebound towards 21600 based on the suggested parallel channel. That's exactly what transpired, and the index did a quick about turn as of Friday's close. The Straits Times Index is executing a similar pattern, which has potential for a short-term Head & Shoulders top. However, note that the RSIs are still relatively oversold on the daily chart, and right shoulders not fully formed in symmetry. An eventual move below the necklines, if it does happen, will offer targets just under 21000 on the HSI & around 2910 on the STI. A break above the shoulder line will negate this picture.


Sunday, November 28, 2010

Hang Seng Index V Short Term: Update

Last post on the HSI suggested that an impulsive decline was likely complete, & a Corrective Rebound towards 23600 was due. We did get a whimper of a rebound up to 23275 but failed to close the gap. At the close HSI breached the previous low of 22800, suggesting more downside.

However, there could be support here just under 22700 based on the parallel channel, as suggested on the chart. Also note the very short-term oversold condition. An overlapping & messy rebound towards 23600 is likely to set up the right shoulder of a Head & Shoulders pattern. Look for a break out of the downtrendline in blue, and a break above 22800 as clues.

Friday, November 26, 2010

SENSEX, Scandals & Socionomics!

In my last update on the SENSEX - "Kimchi Curry, anyone?" - we were at a cross-roads. Along with its maternal twin, the Seoul KOSPI, the index looked vulnerable for a correction. Instead, the Sensex took off to test all-time highs, with the Korean brother not far behind. The test failed & a sharp correction ensued. Price is just about to reach a significant trendline around 18,800 (as highlighted in the chart), with promise of a short-term bounce at least. Upside capped by congestion at 19,800.


Wave Count & Supports

In the longer-term, it is possible that we have finished 5-waves up since 2009, as illustrated on the chart above. If so, we are potentially looking at a bigger & longer correction here. Possible fibonacci retracement levels - 23.6% & 38.2% - are roughly at 18000, and 15600 respectively. They are also strong historical support levels and thus great buying opportunities!

Alternative Bullish Count: Waves 3 & 4 could be nested i & ii waves in an extended wave 3. In this case, we may not see 18000, and the SENSEX may continue higher to all-time new highs from here, Jakarta style!

Sensex, Scandals & Socionomics

According to the emerging field of socionomics, stock market prices are the result of the social mood  of the population in question. During periods of negative social moods (bear markets), some of the biggest scandals & frauds are unearthed. There are countless examples in history, with the most recent high profile case of 'Bernie' Maddoff.

"India has been rocked this year by a series of corruption scandals that have embarrassed the ruling Congress party, rattled markets and delayed reform bills as the opposition stalls parliament.  "... Read more. All during the recent attempt of the Sensex to get out of the bear market slump, and picking up steam during the recent declines. Feel free to research & point out any other examples in other parts of the world. You will be suprised how predictable these outbreaks can be.

All the best!

Wednesday, November 24, 2010

$USD breaks out of downtrend

The US Dollar index has broken above its downtrendline, but is being pegged down just under resistance at $80, as suggested previously. A break above this level would be bullish with a target of $84. At the same time, it seems to suggest continued weakness in commodities and equities, in the near future.

Tuesday, November 23, 2010

Hang Seng Index, Short Term: An Impulsive Decline

With today's 600-point decline to the 22800 level, HSI has completed what-looks-like a 5-wave decline, or in 'Elliott speak', an Impulsive Decline. It has now reached the most recent support area, and thus a likely point for a Corrective Rebound towards 23600-23800 level, which might materialise in a 3-wave overlapping format. Feel free to browse the Elliott Wave tutorial under 'Education & Resources' if the terms intrigue you. Here's the daily chart:


Head & Shoulders

If the above is indeed a 5-wave decline, principles of Elliott Wave Theory dictate that some form of corrective upward action is due, before another decline to new rally lows. Classical technical analysts might identify this as a potential Head & Shoulders pattern. It's still early days though. A break above 23800, or an immediate break below 22800 will make this less likely.

Other Asian Markets

Other Asian markets (such as the STI) seem to be executing similar patterns too. The SSEC's bullish medium-term picture is in danger of a truncation, after the impressive runup and the deeper-than-expected decline. It might be prudent to take profits on the impending rebound.

All the best!

Saturday, November 20, 2010

S&P500: One more re-test of the highs?


Since the May-10 correction ended in Jul-10, SPX has moved up against an atmosphere of doubt and skepticism, and retested the highs. The rise does look impulsive so far on teh daily chart and seems be tracing out a 4th wave, which implies one more attempt at the highs before a significant correction. Short-term resistance around 1205. Here's the 2-hourly chart, showing a break of the downtrendline.

Wednesday, November 17, 2010

Correlations: $USD vs Commodities, $USD vs Equities


In response to one of my posts on the USD, a fellow investor at this forum rightly pointed out that the inverse correlation between USD and Commodities is stronger than between USD and Equities. Charts of USD vs the CRB & DJ World Indices are shown above. Even then, most USD turning points also turned out to be turning points for equities in the past 3 years. Hence, my view that it is a good idea for an Equity trader to keep an eye on the USD direction as well.

Hang Seng Index: Support at 23000 again

Since the break above 23000, HSI traced out a successful back-test once, before resuming higher towards 25000. An overbought negative divergence created a sharp move lower, coinciding with the dip in the SSEC. Although now oversold on the hourly, the initial support at 22500 did not hold up. Next solid support level is at 23500, with additional help from the rising channel line. A second successful retest might see us range-bound between 23000-25000 for a while, before launching higher towards 27000 area. A break below 23000, will be bearish medium-term.

Tuesday, November 16, 2010

$USD Rockets higher

Last post, "USD Rebound around the corner", suggested that the drop below $76 could be a false break. An initial rebound target of $78 was set. Yesterday, USD took off, breaking above this level, and more critically threatening to break out of the downtrendline. Equities have dipped in response. Resistance from the downtrendline and the $80 level, could see a back-test here. However, a confirmed break above $80, could keep Equities depressed for a while longer.

Shanghai Composite Very Short-Term: Positive Divergence


Here's a 60-min chart of the SSEC. Note the 3-wave decline (so far) from the recent high of 3180. Also note the positive RSI divergence on the latest decline. And coupled with support around the 2850 region, a bounce is likely here in the very short-term towards the 3050 region initially.

Friday, November 12, 2010

Shanghai Composite Plunges: Was it the Interest Rates?!


Just google, and you will find a few dozen reasons trying to explain why Chinese stocks plunged over 5% today. The question: Did these websites or analysts help investors GET OUT in time? Nope.

Ok, fine. So did they help investors GET IN, in time for the rally? Here's another 'expert' analyst view in June 2010, with SSEC trading around 2430:


Subsequently SSEC has gone as high as 3180, a 30% gain! So much for expert opinions.


So who knew about the Rally?

Folks who read up a bit of Elliott Wave Theory & basic Technical Analysis, knew with some degree of probability, that a five wave move in one direction is generally followed by a 3 wave move in the opposite direction (most of the time). This was the basis of the bullish call a few months ago on this blog.

And how about the PLUNGE today?

The extent of the decline (a whopping 5%) was not possible to envision, but we sure were setup for a fall. Although i couldn't publish this chart in time, here's three technical observations about the setup (see chart below):

1. Historical Resistance at 3180
2. Overbought with a clear negative divergence on the Daily chart.
3. Overbought on the Weekly chart.(not shown)

And the catalyst (Interest Rate Hike) magically appears at this juncture! For the fundamental folks, this was a classic example of how technicals can help time your investment decisions better.


So what's next?

This move down looks like the back-test of the breakout above the downtrendline. Crucial historical support is also nearby around 2900. If we stay above the line, we may go sideways here for a bit before any attempts higher. I may buy SSEC around the 2900 level, with a Stop at 2850. An unlikely break down here below 2850, changes the picture, and has support at 2700. Watch the volumes on this pullback for clues.

The medium-term target of the previous high of around 3480, still stands for now.

Hang Seng Index - very short term

On a side note, HSI has corrected as well, and seems to be developing a positive divergence on the hourly, indicating potential for a handsome rebound sometime next week.

All the best!

(EWI) FOREX FreeWeek!

Our friends at Elliott Wave International have just announced the beginning of their popular FreeWeek event, where they throw open the doors for you to test-drive some of their most popular premium services -- at ZERO cost to you.

You can access all the intraday, daily, weekly and monthly forecasts from EWI's Currency Specialty Service right now through noon Eastern time Thursday, Nov. 18. This service is valued at $494/month, but you can get it free for one week only!

With Stock & Currency markets poised at crucial junctures, I trust you will benefit from their view points. Click here to access these resources. All the best!

South East Asia back at all-time-highs!

The last time i showed this chart, price was just hanging below the upper parallel line. Since the breakout, we've had a powerful run in SE Asia, led by Indonesia(which has gone on to all-time new highs). With overbought negative divergences across major indices & the dollar potentially rebounding, we could see a pause here before an eventual breakout to new highs. Support is just below the 170 area on this chart.

Monday, November 8, 2010

$USD Rebound around the corner

Since the last post on the USD, there was a rebound to the $78 level, before another breakdown, which broke the lower critical support line. However, given the positive RSI divergence, this could be a false breakdown as the subsequent sharp rally seems to suggest. A rebound is possible towards $78 level initially, implying a pause in the current rally in world markets. On the other hand, a failure to break back up above the line will point towards a much lower USD & higher stock prices in the medium-term.

Wednesday, November 3, 2010

"Market Manipulation" Is Not Why Most Traders Lose
A look at EWI president Robert Prechter's requirements for successful trading
November 2, 2010
By Elliott Wave International

How often have you heard analysts refer to a down day on Wall Street as "traders taking profits"? Sounds great, butthe sobering fact is that most traders -- in futures, commodities, or forex -- lose money. Any book on trading will list for you the many reasons why most traders lose. Yet some traders do win; some even set records. In 1984, Elliott Wave International's founder and president Robert Prechter won the U.S. Trading Championship, setting a new all-time profit record of 444.4% in a monitored real-money options account. Later in his monthly Elliott Wave Theorist, Prechter published a Special Report "What A Trader Really needs To Be Successful" with 5 important insights for would-be market speculators (including the explanation of why "market manipulation" is not why most traders lose.)

Here's a quick excerpt -- and to read Prechter's Special Report in full, free, look below.


"What A Trader Really Needs To Be Successful" (excerpt)

By Robert Prechter
Ever since winning the United States Trading Championship in 1984 (see footnotes, p.4), subscribers have asked for a list of "tips" on trading, or even a play-by-play of the  approximately 200 short term trades I made while following hourly market data over a four month period. Neither of these would do anyone any good. What successful trading requires is both more and less than most people think. In watching the reports of each new Championship over the past three years, it has been a joy to see what a large percentage of the top winners have been Elliott Wave Theorist subscribers and telephone consultation customers. (In fact, in the latest "standings" report from the USTC, of the top three producers in each of four categories, half are EWT subscribers!) However, while good traders may want the input from EWT, not all EWT subscribers are good traders. Obviously the winners know something the losers don't. What is it? What are the guidelines you really need to meet in order to trade the markets successfully?
When I first began trading, I did what many others who start out in the markets do: I developed a list of trading rules. The list was created piecemeal, with each new rule added, usually, following the conclusion of an unsuccessful trade. I continually asked myself, what would I do differently next time to make sure that this mistake would not recur? The resulting list of "do's" and "don'ts" ultimately comprised about 16 statements. Approximately six months following the completion of my carved-in-stone list of trading rules, I balled up the paper and threw it in the trash. What was the problem with my list, a list typical of so many novices who think they are learning something? After several months of attempting to apply the "rules," it became clear that I made not merely a mistake here and there in the list, but a fundamental error in compiling the list in the first place. The error was in taking aim at the last trade each time, as if the next trading situation would present a similar problem. By the time 16 rules are created, all situations are covered and the trader is back to square one. Let me give you an example of the ironies that result from the typical method of generating a list of trading rules. One of the most popular trading maxims is, "You can't go broke taking a profit." (The brokers invented that one, of course, which is one reason that new traders always hear of it!) This trading maxim appears to make wonderful sense, but only when viewed in the context of a recent trade with a specific outcome.
When you have entered a trade at a good price, watched it go your way for a while, then watched it go against you and turn into a loss, the maxim sounds like a pronouncement of divine
wisdom. What you are really saying, however, is that in the context of the last trade "I should have sold when I had a small profit."
Now let's see what happens on the next trade. You enter a trade, and after just a few days of watching it go your way, you sell out, only to stare in amazement as it continues to go in the direction you had expected, racking up paper gains of several hundred percent. You ask a more experienced trader what your error was, and he advises you sagely while peering over his glasses, "Remember this forever: Cut losses short; let profits run." So you reach for your list of trading rules and write this maxim, which means only, of course "I should NOT have sold when I had a small profit." So trading rules #2 and #14 are in direct conflict. Is this an isolated incident? What about rule #3, which reads, "Stay cool; never let emotions rule your trading," and #8, which reads, "If a trade is obviously going against you, get out of the way before it turns into a disaster." Stripped of their fancy attire, #3 says, "Don't panic during trading" and #8 says, "Go ahead and panic!" Such formulations are, in the final analysis, utterly useless. What I finally desired to create was a description not of each of the trees, but of the forest. After several years of trading, I came up with -- guess what -- another list! But this is not a list of "trading rules"; it's a list of requirements for successful trading. Most worthwhile truths are simple, and this list contains only five items. ...

Read the rest of Prechter's report now, free! Here's what you'll learn:
  • Why a trading method is a "must" for your success
  • What part discipline plays in your trading success
  • Why "market manipulation" is not why most traders lose
  • How to gain trading experience
  • More

This article was syndicated by Elliott Wave International and was originally published under the headline "Market Manipulation" Is Not Why Most Traders Lose. EWI is the world's largest market forecasting firm. Its staff of full-time analysts led by Chartered Market Technician Robert Prechter provides 24-hour-a-day market analysis to institutional and private investors around the world.

Friday, October 29, 2010

S&P500: Trendline Watch

While the SPX is rangebound in the doldrums, here's the 15-year SPX chart once again. Good news for the bulls: the current consolidation is occuring just after a break above the downtrendline joining the Oct07-May10 tops. Good news for the bears: The decade old parallel channel line resistance(red line) is just above around 1210, followed by 1220 horizontal resistance.


With the weekly RSI overbought & dollar finding support as well, it would probably be prudent for bulls to take profits at this point, and wait for a positive break above 1220, before initiating fresh positions.

All the best!

Tuesday, October 26, 2010

Shanghai Composite: Another breakout

Since the breakout above 2700, SSEC has rapidly climbed up to the upper downtrendline. In the past few sessions, there has been yet another breakout - this time above the downtrendline. Take a look at the weekly chart below. Next target is the wave A high of around 3480. However, with the weekly RSI reaching overbought, i'd await confirmation - some form of consolidation around the 3100 level + a successful retest of the line from above - before adding new positions. Horizontal support around 2900.


All the best!

Saturday, October 23, 2010

Hang Seng Index: Support at 23000

HSI has been consolidating its recent rise to new rally highs. Support is at 23000. A successful retest here of the breakout, might see higher levels medium-term, towards the 27000 level.

Sunday, October 17, 2010

Shanghai Composite: The Tiger Roars!


The crouching tiger, took the leap and then roared this week! Check out the volume - a stamp of classic third wave action! Broke through the 200-day MA with ease. In the very-short-term, overbought and approaching significant overhead resistance around the 3000 level. A sideways consolidation followed by a breakout would not surprise. The eventual minimum target of 3480 (the wave A high) still applies. For now, i'll be holding my medium-term positions and staying on board this chinese train.

All the best!

USD hits Support.


The above is a weekly chart of the US Dollar Index. Markets are at an interesting juncture with emerging markets leading with minor breakouts to the upside. $USD at oversold & has reached trendline support here. A successful rebound may have bearish implications for global equities in the short-term, and conversely a break below would be medium-term bullish for equities.

Initial resistance on rebound is 80, while initial support is 74.

Friday, October 8, 2010

Shanghai Composite: The Tiger Leaps!

My last post, "Shanghai Composite: Crouching Tiger" suggested an impending breakout above 2700. Today, the Tiger took the leap on high volume (+ 3.13%). I have added some long positions with a stop just below 2700. The initial target of 2900 from my last post still stands, with a potential short-medium term target of 3100. Watch out for resistance from the descending trendline.

All the best!

Thursday, October 7, 2010

Hang Seng: Expect Consolidation Here

Last post on the HSI suggested 23000 as the first stop, in this medium-term bullish breakout. We're there now, and also at the top of the channel as shown. Expect a back-test of the breakout here, or at least a sideways consolidation over the next few weeks, before any further upside. A sustained break above 23000 right now might turn it into a strong support level instead.

Wednesday, October 6, 2010

Video (Part 3): Prechter - Investing in Extreme Markets

(Note: This interview was originally recorded on September 20, 2010)

In the video below, Robert Prechter talks to Yahoo! Finance Tech Ticker host Aaron Task and Henry Blodget about a technical pattern he sees forming in the Dow.


Get Up to Speed on Robert Prechter's Latest Perspective — Download this Special FREE Report Now.

Video (Part 2): Prechter: Ominous Pattern in the DJIA

(Note: This interview was originally recorded on September 20, 2010)

In the video below, Robert Prechter talks to Yahoo! Finance Tech Ticker host Aaron Task and Henry Blodget about a technical pattern he sees forming in the Dow.


Get Up to Speed on Robert Prechter's Latest Perspective — Download this Special FREE Report Now.

Video (Part 1): Prechter On Market Rally

(Note: This interview was originally recorded on September 20, 2010)

In the video below, Robert Prechter talks to Yahoo! Finance Tech Ticker host Aaron Task and Henry Blodget about extreme readings in various indicators that confirm his bear-market forecast.


Get Up to Speed on Robert Prechter's Latest Perspective — Download this Special FREE Report Now.

S&P500: Make or Break time!

In March this year, i suggested "Sell in May and go away", based on a 15-year SPX chart. In May, the SPX peaked at 1220 right on the dot as shown on this chart. Now, it's make-or-break time for the S&P500. It is up against downtrendline resistance joining the Oct07-May10 tops, and overbought. Just above is the long-term trendline(red) that stopped the SPX dead in its tracks in May. Which way is it gonna go?


The answer may lie in this daily chart below. SPX is currently also up against the blue upper channel line.


Considering seasonality, chances are it will turn here. But if it does zoom up above those trendlines, the correction may have ended at point A, and we may be reckoning with a wave 3 up here with a test of the highs looming.

Look for a impulsive decline below 1130, or a continued surge above the downtrendlines.

All the best!

Thursday, September 30, 2010

Funda-MENTALs for the Short-Term?!

The futility of buying or selling stocks in the short-term, on fundamental news/data, was laid bare by today's Shanghai market action!

THE NEWS:

"China Government Moves to Curb Lending
China has tightened limits on mortgage lending and plans to roll out a new tax on home sales, acting once again to cool a property market that some fear is frothing into a bubble. The required downpayment for a first home purchases rises to 30 percent, up from 20 percent, while purchases of second homes will require a 50 percent downpayment, up from 40 percent. Loans for purchases of third homes are banned, said the announcement on the government's website."

MARKET REACTION:
 Up 1.72%!

And just a few weeks ago, this same market would've dived on such news.

China market will be closed for the whole next week, as the population there does its' yearly mass migration. Traders might wanna sit out, and wait for a break above 2700 before going long.

All the best!

Monday, September 27, 2010

(Video) Nifty: Expect New Highs by Year End.

In May, i posted this video interview of Mark Galasiewski , who is the editor of Asia Pacific Financial Forecast, at Elliott Wave International. He had then called for Nifty 6000. And now with Nifty springing above that level, here's another of his interviews with ET:

Mark Galasiewski Interview, Sept 23

Enjoy!

Saturday, September 25, 2010

Hang Seng Index Bullish Breakout

Hang Seng Index broke above a significant downtrendline as indicated in previous posts. Due for a backtest of the breakout in the short-term, which if successful, points towards a bullish medium-term outlook. Immediate resistance is previous high of 23000. Further upside levels are indicated on the chart.

Friday, September 24, 2010

S&P500 Hourly: Negative Divergence

SPX setting up a negative divergence with RSI, implying a pullback is due in the very short-term. I would wait for the RSI to hit 70 before initiating a day-trade, with a stop just above last high. Supports at 1130 & 1123.

Wednesday, September 22, 2010

S&P500: Trendline Watch

Last post on 5-Sep, called for a move up into the 1130-1150 range on the SPX, followed by a U-turn. We're there now, and it remains to be seen, if there's gonna be an impulsive decline to follow. The likely location for the reversal is around 1150, or the upper line of the blue channel. A move back below 1130 would be the first step. The potential spoiler to this scenario is the rough Inverse H&S formation that is just breaking out.


(Alternate View: the A-B-C was completed in Jul, and SPX has just embarked on a new uptrend.)

Let's see if the Sept Equinox can spoil the party for the Bulls. All the best!

Saturday, September 18, 2010

Youth today - Leaders tomorrow!

As we wait for the the September Equinox to try and rattle the markets, here's something interesting. The image below is the top 20 gold medal tally, from the recently concluded Inaugural Youth Olympic Games, in Singapore.


How many of them are Developed countries, and how many of them Emerging Markets? Cuba & Azerbaijan in the top 20? Youth of today, Leaders of tomorrow?

Wednesday, September 15, 2010

Socionomics - Prechter's Genius

Robert Prechter of EWI, has made some brilliant calls in his career. Although he may not have been on the  money, with his recent short-term market calls, but here's why i've loads of respect for this guy - the man's a genius when it comes to socionomics.
-------------------------------------------------------------------
Tea Party: Why NOW?
By Vadim Pokhlebkin

The Tea Party has gathered enough momentum to become a political force. According to an April Gallup Poll, "28% of U.S. adults call themselves supporters of the Tea Party." (gallup.com)
Earlier this year, New York Times columnist David Brooks wrote this (underline added): 
"Over the course of this year, the tea party movement will probably be transformed. Right now, it is an amateurish movement with mediocre leadership. But several bright and polished politicians... are unofficially competing to become its de facto leader. If they succeed, their movement is likely to outgrow its crude beginnings and become a major force in American politics."

I realize the Tea Party itself is a politically charged topic. But set aside your personal opinions for a moment, and please read the quotes below. They are from Robert Prechter's October 2003 Elliott Wave Theorist.

In that issue, EWI's president gave several prescient forecasts regarding social life and politics in the coming bear market (underline added):
  • "Social groups, including economic, political, religious, genders and classes, will polarize and splinter further. I.e., they will polarize both internally and with respect to opposing groups."
  • "Both patriotism and anti-government sentiment will grow into powerful emotional forces."
  • "Politics will become far more polarized, splintered and radical."
  • "The U.S. will accelerate its trend toward socialism. Opposition to that trend will be vigorous."
  • "Third parties will gain political clout and win local elections. Libertarians, greens and others will capture many local offices and probably at least one state government." 
How was Bob Prechter able to predict the emergence of a third party and the polarization that's been tearing this country apart for the past few years?

He did so by using socionomics, the new science of social prediction based on the Elliott Wave Principle. It postulates that social mood (an unconsciously shared herding impulse) drives social events. Elliott wave patterns in stock market charts reflect social mood. Thus by forecasting the stock market you can also anticipate the tenor of social events -- often with stunning accuracy, as you can see.

Find the idea of socionomics fascinating? You're not alone -- the folks at EWI's sister organization The Socionomics Institute share your passion. You can read their latest socionomic observations and forecasts every month in The Socionomist. Take a look at what's inside the latest issue. (You also get instant access to May, April, March and February Socionomist issues.)

Friday, September 10, 2010

Shanghai Composite: Crouching Tiger?

SSEC has been crouching just below 2700 level for the past few weeks. The two possibilities in my view are shown on the chart. Whichever the case, i'm looking for an initial target between 2900-3060 in the short-to-medium-term, and possibly even higher in the medium-term. Depending on your chosen vehicle for trading the SSEC, you may be outperforming big time, especially if you are in a small-cap focused etf or fund (Check out the FTSE Xinhua charts below).


(FTSE Xinhua) All-Share Index vs China A50 Index vs Small Cap Index

China A50 approximates the performance of SSEC.

The Small Cap Index has already exceeded its all-time-highs! So, it pays to know your etf/fund. Please do your own research on performance, as i am unable to provide specific fund/etf recommendations.

The long-term outlook for China is not necessarily all bullish. For my longer term view on the Shanghai Composite, check out this earlier post: "Shanghai Composite: Why i am BULLISH medium-term!".

So, where are the long-term Bull Markets?

If you wanna find out where the Asian Bull Markets are, I highly recommend this excellent copy(older edition) of the Asian Pacific Financial Forecast, from Mark Galasiewski of EWI - can be downloaded for free - covering the major Asian markets.

Enjoy!

Sunday, September 5, 2010

S&P500: Trendline Watch

S&P500 has reached the downtrendline as suggested, and may now take a breather, before breaking above it. Very Short Term, support is at 11001085. My primary view in the medium-term: a move up towards 1130-1150 is possible to finish this complex B wave. Still expecting a C-wave tumble towards 950 after that, to possibly end the correction. Watch the blue channel on a break above the maroon channel.


All the best!

EWI Free Week for Asian & European Markets!

Hello folks,

Elliott Wave International has just announced the beginning of their wildly popular FreeWeek event.

You can access(for FREE) EWI's short-term analysis of Asian-Pacific (such as China, India, Hong Kong, Singapore, Japan, Taiwan, Gold) and European markets from EWI's Short Term Update services right now until noon Eastern time Friday, Sept. 10.

I trust you will benefit from this analysis. Remember, it is a limited time offer.

You can click here, or on the banner above to access the content. (You may have to sign up for a free club member id, if you haven't done so already)

Enjoy!

Thursday, September 2, 2010

S&P500: 1100 is the line in the sand

A solid break, out of the channel! Expect initial resistance at 1090.


Expect stiff resistance at 1100 - the historical resistance, as well as the location of the downtrendline. In other words, it may be the line in the sand separating bulls from bears.


Meanwhile in Asia, Shanghai Composite seems to be in the "crouching tiger" phase, before a possible break above 2700. All the best!

Sunday, August 29, 2010

Bankers' Song - We Didn't See It Comin!

Friday, August 27, 2010

S&P500 Very Short-term: Up against Channel Resistance

1040 acts as solid support once again! The strong rally towards 1065 in the last session, will run into resistance(channel) around here, and at the congestion area around 1070. Would be interesting to see if 1060 holds during the ensuing consolidation. If it DOES, we may see 1080. If it DOES NOT, we may be about to find out how solid (or not) 1040 really is!

Wednesday, August 25, 2010

MSCI Emerging Markets & HSI: Trendline Break

MSCI Emerging Markets Index looks like it has completed a B wave up, and is probably setup for an impulsive C decline over the next couple of months. Strong support in the 900-910 area, a failure of which will open the door to 825-830 region, to end the correction.
On a related note, Hang Seng Index (HSI) has broken its short-term uptrendline and may be headed lower to the 19800 region initially. Further supports at 19400 and 19000. In the very short-term, a rebound is possible to re-test the trendline break.

All the best!