Wednesday, July 7, 2010

S&P500 short-term: Resistance Levels


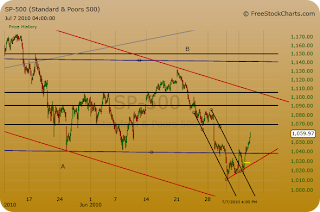
SPX has broken above the "neckline" of 1040 (although on lower volume) negating the possible Head & Shoulders. Medium-term trend is still down & the short-term outlook is neutral, unless we break back below 1040. The asian indices have not come close to forming a H&S thus far.

Overbought in the very short-term, lots of resistance levels to the upside at 1060-1070, then 1090-1105(or where the upper trendline is). 1040 is now support.

A sustained break above the upper trendline will be bullish medium-term. We could've completed an A-B-C of a larger corrective pattern(or still nesting for a big impulse down), we will find out soon enough. All the best!

Prechter on CNBC: Prechter's Perspective on Stocks

Robert Prechter joins host Maria Bartiromo on CNBC's Closing Bell to talk about his bearish forecast for stocks and offer investment advice.


FREE Report: 20 Questions with Robert Prechter
Noted financial commentator Jim Puplava asks Robert Prechter tough questions about fiat currency, gold, the Fed, the Great Depression, financial bubbles, government intervention and how to protect your money -- and even profit -- in today's environment. Read Prechter's candid answers for FREE now. Access the 20-page report here.

Monday, July 5, 2010

Shanghai Composite: Why i am BULLISH medium-term!

Last week's decline on the SSEC, got tongues wagging & China bears smacking their lips in excitement. This weekend i suggested that this was the final shake&bake, to throw panicked retail feeders off the trail. And yes, i maintain my medium-term bullish and long-term bearish, outlooks. Just like it has in the recent past, Shanghai will probably lead again with the recovery. This long-term chart below, going back 13 years, speaks volumes:

Elliott Wave Theory

... is the primary reason i expect another wave up. After an impulsive decline from the 2007 highs, a corrective move up is expected, (most likely in the form of an A-B-C), followed by another impulsive decline. SSEC led the world recovery in Dec'08 with an impulsive wave A up(stopped by the 38.2% fibonacci retrace), and has since gone sideways-then-downwards in wave B. Now we can expect a wave C up. (Elliott Wave corrections can turn up in other variations, but this is the primary view for now)

Trendlines

... let's justify the name of the blog! From the chart above(click to enlarge), observe three different trendlines converging in the 2200-2300 area (green circle):
  1. Bottom channel line
  2. Horizontal line from 2001 top
  3. Rising trendline connecting 2005 & 2008 bottoms
Hence, a high probability area for a turn. Now let's zoom in:

Observe the following
  1. Price is currently holding at the 61.8% retrace level, and a natural historical support level.
  2. Declining volume with the decline in price
  3. Clear positive divergence on the daily RSI
Socionomic Reasons

Introduced in an earlier post, socionomics is the study of social mood and its results in social actions. Here are some contrarian signals suggesting China may be reaching a short-term extreme in negative sentiment:
  1. Widely publicized labour strikes for wage increases.
  2. Bad fundamental(PMI) data, adding to negative news flows.
Suppport Levels & Targets

In the short-term, prices may take a while to stabilize, before a rebound. As long as they remain above 2200, the medium-term bullish view remains in force. The next serious support is the previous low of 1750.

Significant resistance level initially is 2700. Minimum target for wave C medium-term would be the previous high of 3450. Further levels to the upside are 3900 & 4400. After that, an impulsive decline should follow, but that is a long way away.

If all the EW talk about impulses & corrections is confusing, feel free to browse this free Elliott Wave Tutorial, or this basic Elliott Wave Video.

Just my view folks, do your own homework & have a plan, before parting with your hard earned dough. All the best!
Karl Denninger's Half-Year Checkup

One of the most vocal in the financial blogging world is Karl Denninger, who runs tickerforum.org. He is pretty bearish on the US economy, and has posted his half-year checkup on the markets. Karl makes very interesting points, especially in the last part about money management. Here're some excerpts:

"...For most, if not nearly all, people who are in the market they have absolutely no business trading actively. This is particularly true in markets like this, where 2, 3 even 4% swings on a daily basis have become commonplace. While the last year has seen these be nearly all upward, the last few weeks and months has seen it be nearly all down.

For the long term investor the point is to wind up with more money than you started with - in purchasing power - over a 10, 20 or 30 year horizon. You cannot afford big mistakes as they will force you to take big risks in order to recover, and if you're wrong on the latter you will wind up with a destroyed account... "

"...The key to making a true fortune in anything folks is to buy smart - not sell smart. This is something I've learned through my entrepreneurial affairs... If you buy smart, making money is easy. If you have to sell smart you're always one mistake away from massive losses and potential bankruptcy. Nobody is good enough to bat 1,000. 600, 700, sure. 1,000? Nope. Not unless you're God - or are cheating...."

"There is no reason in a deflationary environment, which we are now in, to add beta to your long-term funds. The cowboys who want to do that with their entire net worth are welcome to it - you'll still have a place to live when they blow up and are under a freeway overpass. Most of them will - indeed, while there is always someone who claims to have "nailed it" ex-post-facto for each big market move, you'll note if you bother to view things through an objective lens that 100 people had opinions prior to the move and only one of them still has an account with a positive balance in it. Worse, that person's prognostications for what's to come next are almost-certain to be dead wrong."

Here's the link to the entire post. Enjoy :)

Sunday, July 4, 2010

"What A Trader Really Needs To Be Successful"

A great article on the psychology of trading.

-------------------------
In 1984, Elliott Wave International's founder and president Robert Prechter won the U.S. Trading Championship, setting a new all-time profit record of 444.4% in a monitored real-money options account in 4 months. In the average 4-month contest, over 75% of contestants, mostly professionals, fail to report profits.

Later in his monthly Elliott Wave Theorist, Prechter published a Special Report "What A Trader Really Needs To Be Successful" with 5 important tips to would-be market speculators. Here's a quick excerpt. (To read Special Report in full, free, look below.)

"What A Trader Really Needs To Be Successful" (excerpt)

By Robert Prechter

There are many denials of reality which automatically disqualify millions of people from joining the ranks of successful speculators. For instance, to moan that "pools," "manipulators," "insiders," "they," "the big boys" or "program trading" (known today as "high-frequency trading" -- Ed.) are to blame for one's losses is a common fault.

Anyone who utters such a conviction is doomed before he starts. [My] observation, after eleven years "in the business," is that the biggest obstacle to successful speculation is the failure merely even to recognize and accept the simple fact that losses are part of the game, and that they must be accommodated.

The perfect trading system does not exist. Expecting, or even hoping for, perfection is a guarantee of failure. Speculation is akin to batting in baseball. A player hitting .300 is good. A player hitting .400 is great. But even the great player fails to hit 60% of the time! He even strikes out often. But he still earns six figures a year, because although not perfect, he has approached the best that can be achieved. You don't have to be perfect to win in the markets, either; you "merely" have to be better than almost everybody else, and that's hard enough.

Practically speaking, you must include an objective money management system when formulating your trading method in the first place. There are many ways to do it. Some methods use stops. If stops are impractical (such as with options), you may decide to risk only small amounts of total capital at a time. After all is said and done, learning to handle losses will be your greatest triumph.
-------------------------

Read the rest of Prechter's 5 tips to would-be market speculators now, free! All you need is to create a free Club EWI profile. Here's what else you'll learn:


  • Why a trading method is a must for your success
  • What part discipline plays in your trading success
  • How to gain trading experience
(Already a free Club EWI member? Finish reading the report here.)

S&P500 short-term: Breakdown towards 950-960

Last post on the SPX, outlined the price action then as bearish, with stiff resistance at 1100. Since then, the index has not looked back and continued down to break below the crucial 1040 area. Oversold manages to remain oversold, which reeks of bear market behaviour (remember how overbought remained overbought on the way up?). Let's take a look at the daily chart.


Medium-Term: Head & Shoulders Target = 860

Although, the right shoulder needed a bit more sculpting, it is close enough to be called a H&S, with volume confirmation. Hence, we are looking at a medium-term target of around 860. Of course, this is the ideal scenario, and the market has to oblige!

Very Short-Term: Immediate Target = 950-960,

This is based on the recent high of 1031, and the wave structure of the decline on the 30-min chart below, lends support to this target.


The decline so far from the B high has an impulsive look, and has completed 4 waves. Expecting one more move down to the 950-960 area, before a significant rebound.

Wave Counts

Maintaining the A-B-C count for now. If it is so, i expect the decline to end around the 950 area(within the corrective channel in red), especially if we subsequently break through 1040 upwards.

Instead, an extended consolidation remaining under 1040, followed by a sharp break below 950 would suggest we're in the alternate wave count suggested in the last post, with very bearish implications (Prechter point!).

The range now is between 950-1040. I await the latest sentiment readings - could provide vital clues in the short-term. All the best & stay safe!