Saturday, September 25, 2010

Hang Seng Index Bullish Breakout

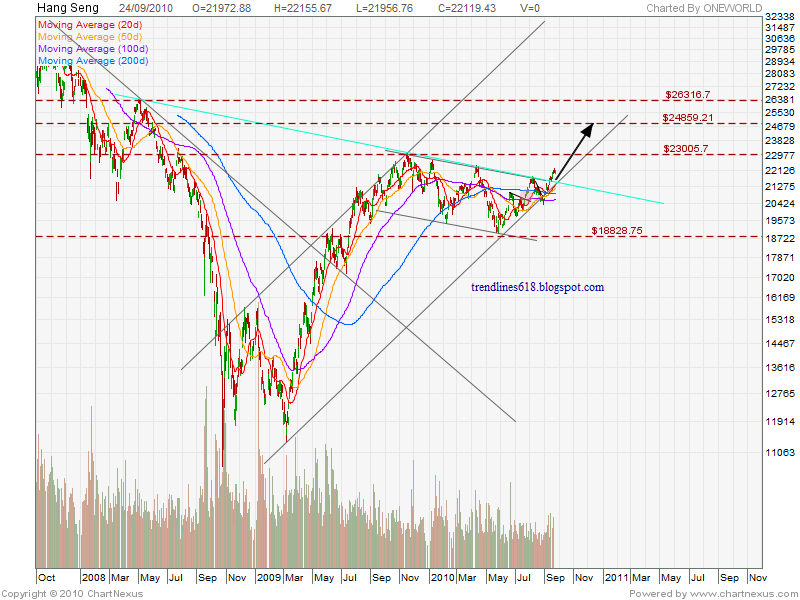
Hang Seng Index broke above a significant downtrendline as indicated in previous posts. Due for a backtest of the breakout in the short-term, which if successful, points towards a bullish medium-term outlook. Immediate resistance is previous high of 23000. Further upside levels are indicated on the chart.

Friday, September 24, 2010

S&P500 Hourly: Negative Divergence

SPX setting up a negative divergence with RSI, implying a pullback is due in the very short-term. I would wait for the RSI to hit 70 before initiating a day-trade, with a stop just above last high. Supports at 1130 & 1123.

Wednesday, September 22, 2010

S&P500: Trendline Watch

Last post on 5-Sep, called for a move up into the 1130-1150 range on the SPX, followed by a U-turn. We're there now, and it remains to be seen, if there's gonna be an impulsive decline to follow. The likely location for the reversal is around 1150, or the upper line of the blue channel. A move back below 1130 would be the first step. The potential spoiler to this scenario is the rough Inverse H&S formation that is just breaking out.


(Alternate View: the A-B-C was completed in Jul, and SPX has just embarked on a new uptrend.)

Let's see if the Sept Equinox can spoil the party for the Bulls. All the best!