Showing posts with label SGX. Show all posts

Wednesday, June 15, 2011

Singapore Exchange & The Straits Times Index

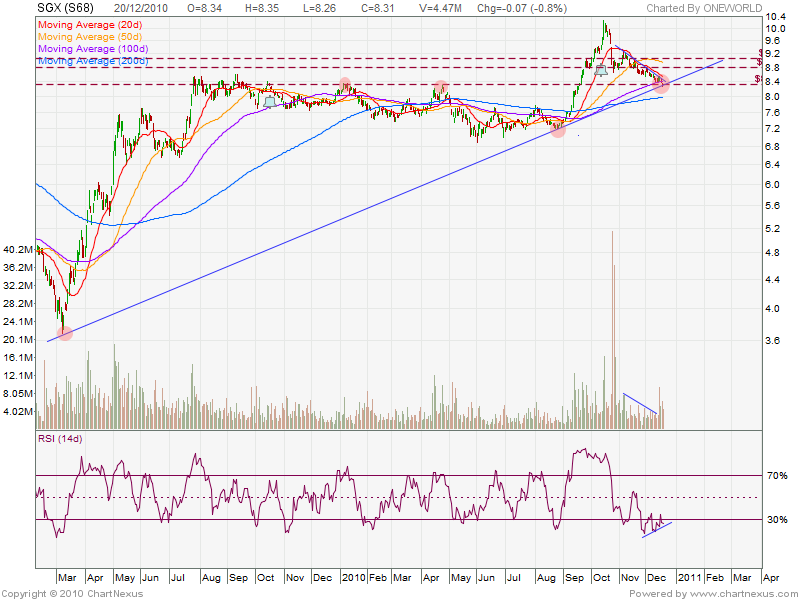
SGX - Set for a bounce?

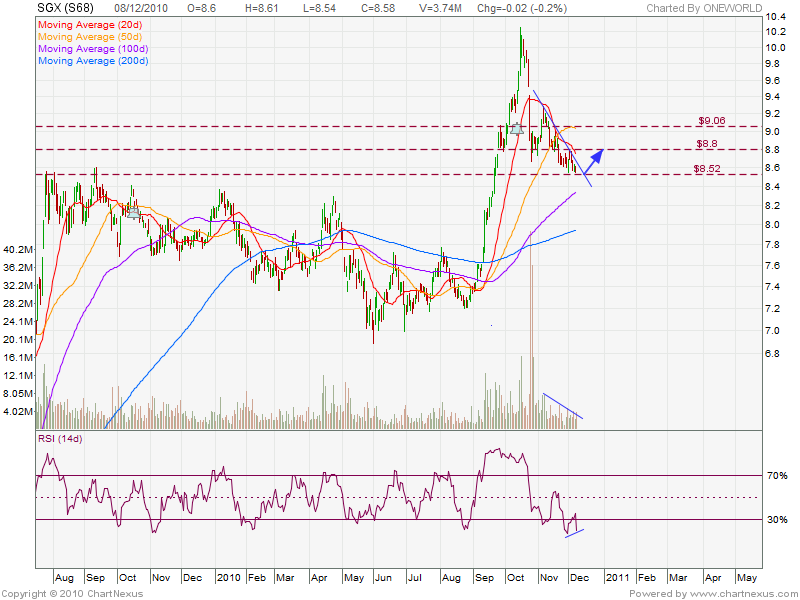
Previous posts on the Singapore Exchange (SGX), speculated on my bearishness on the merger as well as the stock price.Since my last post noting a break in the uptrendline for SGX, prices have declined, attempted a back-test, and declined again. A technical bounce is likely for the SGX here, around $7.20. Supporting this view are the declining volumes and the RSI divergence. A sustained break below this level on increasing volumes will negate this play. Upside is limited to the $7.70 pivot initially, or the downtrendline(blue) whichever comes first.


STI - At support, but no reversal signals yet

On the other hand, the Straits Times Index (STI) has not thrown up any reversal signal yet. But price is at a decent support level here at 3040. With weak global cues going in the summer holidays, it remains to be seen if STI can muster enough buyers to move up towards 3120. Further support is as shown on chart.


All the best!

Thursday, February 24, 2011

Singapore Exchange: Breaks Medium-term Uptrend

SGX breaks medium-term uptrendline, and also the 200-day MA. This is bearish action. Currently around $8.00 round number, and may offer a back-test of $8.25. Next significant support is coming in at $7.70. As SGX did not break downtrendline since my last post, no long position was taken. For those who did, i trust that stop-loss strategies were used!

Tuesday, February 15, 2011

Singapore Exchange: Decision Time

SGX has been drifting in a range since the merger-euporia-rally, and the high volume fall. From the arithmetic chart below, it is evident that a move eitherways in required. Currently sitting on previous support of $8.25 and the rising trendline, with the 200-day MA not far below, chances of a bounce here outweigh a decline - by a bit. I may go long here, with a suitable stop.


Upside targets: $8.70 initially, followed by $9.20
Downside support: 200-day MA initially, followed by $7.70

Remaining bearish on the long-term picture as well as the merger. All the best!

Monday, December 20, 2010

Singapore Exchange: Back to the drawing board!

Last post on SGX, suggested a possible bounce as long as price stayed above $8.50. It didn't, and as promised i went back to the drawing board. Here's what i found. SGX is sitting on a trendline going back to the 2009 lows, and is at an important support level around $8.30. With the STI on neckline support at 3120, this is as good a place as any for a rebound. I will wait for the break of the short-term downtrendline, before initiating a trade. Resistance levels as per last post, with $8.50 level as additional one now.


A break below the uptrendline & $8.30 level could be medium-term bearish for SGX. As always, i will have a suitable stop-loss in place. All the best!

Overall, the long-term chart of SGX doesn't suggest strength so far, which leads me to theorize that the merger may not work out eventually! Time will tell, but charts do whisper and occasionally yell. ;)

Wednesday, December 8, 2010

Singapore Exchange: Short-term bounce ahead?

A classic case of  "Buy the Rumour, Sell the News"! After SGX went vertical, it collapsed (as all parabolic moves eventually do), and is now back at previous rally high of $8.50. Coupled with the oversold indication on the daily RSI, it is a good place for a short-term bounce towards $8.80 initially,  probably followed by $9.00 & $9.30. A sustained break below $8.50 at this stage will have us back at the drawing board!


As if by coincidence, expect some positive news flow about the SGX-ASX merger in the coming weeks! ;)

Monday, July 26, 2010

SGX: Final call for boarding!

It's been a while since the last update on the SGX, the Singapore Exchange. After a few futile attempts to clear upper channel resistance, SGX has been in consolidation mode for months. Last session saw a breakout of a wedge pattern on decent volume, and may be the beginning of a rally of sorts.


Bad Weather Overhead

Unlike the last time, this may not be a rocket-launch, but a gentler takeoff - lots of bad weather overhead. In the very short-term, a back-test is possible. Resistance levels to the upside are at 7.66, 7.90, upper downtrendline, 8.11, 8.5 & 9.0

Eventual target of 9.0 is possible, especially on a break above the downtrendline. This blog usually doesn't cover individual stocks. If you are curious, here's why i cover this stock.

Thursday, April 15, 2010

SGX: Escape Velocity?

In a previous post - SGX short-term: Ready for Liftoff? - the below chart was presented, proposing an imminent launch for SGX with a target of 8.3.


Well, prices hit a high of 8.31 in heavy volume today, before closing at 8.26 - a gain of 8.5%.


Escape Velocity?

Ok, so we have liftoff! The question is do we have escape velocity, to clear earth's orbit? The big clue is in the volume spike. No guarantees, but i am expecting a breakout, followed by a back-test and consolidation, as prices are currently in the overbought region.  Alternatively, consolidation could occur just below the upper channel line, before an eventual breakout.

Resistance & Support levels

A breakout will meet immediate resistance in the 8.8 region, but could go for an eventual target of 10.8 (50% retracement level) in the medium-term. A rejection here, on the other hand will find support at the bottom channel line initially.

Implications
Remember, SGX is a barometer for Singapore and the region. Although, i am expecting a pull back for Asian markets short-term, a breakout for SGX above 8.8 (if & when it happens), might have bullish implications in the medium-term for SE Asia markets in general.

Strap on some oxygen tanks folks, the air is thin up here. All the best!

Saturday, March 13, 2010

Straits Times Index & SGX Update

Straits Times Index (STI)

Since the last World Markets Update calling for an upwards breakout, STI has moved up almost 5%. The suggested target was 2880 & a reversal. Friday's action saw it close at 2881.


Will it go all the way to the highs of 2950? Nothing is impossible in the world of stock markets, but we can expect some sorta struggle around here. Will it make new highs and keep going upwards? Unlikely, as the fall from 2950 was in 5-waves. Expecting consolidation next week before anymore big moves.

Singapore Exchange (SGX)

The barometer stock! Since my last post SGX short-term: Ready for liftoff! at 7.60, prices have moved up handsomely on relatively higher volume to a high of 7.88.


So what's next? 7.9 area is stiff resistance, so expecting a struggle here. Will we go all the way to the upper trend channel? Watch the consolidation. If it moves sideways and not sharply downwards, a move higher becomes likely. A break below channel line however, makes a move towards 6.8 more likely.

SGX - A Barometer or a Warrant?

Now for the fun part. Those following my posts have observed, that i refer to SGX as a barometer for the financial weather of Singapore. Simply because, activity on Singapore stock market is directly proportional to the growth of the economy. Higher activity is higher revenue for SGX, and vice versa. Also, have a look at the chart below:

SGX tends to act like a leveraged warrant on the STI - at least in the recent past. Based on that observation, might be fun to keep this chart handy. SGX has crossed below STI for now, whatever that means!

Summary

There might be upside left for STI & SGX, but in the very short-term expecting consolidation. I will present an elliott wave review of SGX at a future date, once there's enough evidence.

Good luck, and your views are always welcome!

CAUTION: Refer to the last part of this earlier post, for caveats as to why technical analysis on SGX might not always be reliable.

Sunday, March 7, 2010

SGX short-term: Ready for liftoff!

Refer to my last post on SGX: Analysis of Singapore's barometer. I did a long and medium term Elliott Wave analysis, with a bearish primary and bullish alternate view. It's time for a review!

Coupled with action on other world indices, beginning to prefer the bullish alternate view - though i admit its too early to tell. For now, i will present just the short-term picture, and review the wave structure at a later time. Here's the short-term chart:


In the last post, i suggested 7.6 and 7.8 as general areas of support and resistance, which have held, more or less. Noted also was the channel (cyan), which is increasingly looking like a bull flag.

And here's why i think SGX is headed higher:
  1. SGX is sitting right on channel support.
  2. General drop in volume between the lows
  3. Positive divergence in the RSI between the lows
Target & Supports

Short-term target will be in the 8.3 region, or wherever price meets upper trendline. There's a hurdle around 7.8. Above view will be negated if we fall below the lower channel line. Next support 6.8 region.

All the best, and alternate views are appreciated!

Saturday, February 6, 2010

SGX: Analysis of Singapore's barometer

SGX is the listed name of the Singapore Stock Exchange. Although not a high volume stock, it is an excellent barometer of the financial weather in Singapore, and the region. To start off, take a look at this beautiful long term chart:


After a breath-taking parabolic rise in 2007 to a high of almost $17, came a nasdaq style plunge that took it to unbelievable lows below $4, in a span of just over an year. A nice study of sentiment right here. Rational and efficient markets, anyone?

The retrace since Mar-09 seems to have stalled just below the 38.2% fibonacci level, indicating lack of strength. Now lets take a look at a medium term chart of SGX:


The price has gapped down through a crucial support level in the 7.80 range, and sitting on the lower consolidation channel line(cyan) and minor support at 7.60. Also, note the rise in volume during the latest downtrend.

Elliot Wave Analysis

Applying elliot wave analysis, the BIG decline from 2007 was in 5 waves. So we'd expect a A-B-C retrace up. Taking the most obvious count, it looks like we did complete a 3-wave move up (with B being the sideways action from may to july). The top of this move was probably in Sep09 at 8.75. If so, a 5-wave move down has begun.

Alternate view (lower probability): The move up since march was A move, and now in a consolidation B down, with a higher C to come.

So what's the weather forecast for SGX?

Short Term: 7.6 is minor support, and 7.8 is resistance. There might be a weak rebound or sideways consolidation next week, to test resistance and support.

Medium term: A break-down is likely towards good support at 6.8 (38.2% retracement)

Longer term: A 5 wave move down to at test the lows of 3.8 is possible.

Caveat & Disclaimer

1. Elliot wave analysis & Finonacci retracements work best in high volume trades (stock indices, forex), and are not reliable for individual stocks. SGX being an important barometer, merited this post.
2. Convincing break of the blue downtrendlines in the short term negates my views.
3. The numbers quoted above are general ranges, and not exact levels.
4. This is a personal view. Please do your own analysis before executing your trades.

Your constructive comments and views are welcome. :)