Tuesday, December 21, 2010

S&P500: Achieved Target Area.

The last post, "S&P500: Wave 5 underway", more than 2 weeks ago, suggested a target of 1255 in the near term. Last session, SPX hit a high of 1256. Are we about to conclude this uptrend since Jul-10? No one can know for sure. But going by the bullish sentiment (refer to last post for chart) & overbought oscillators, it would not hurt to err on the side of caution here & take some off the table, for a short-medium term trader.


Note the slight negative divergence on the daily chart. Of course, this uptrend could continue and hit the upper line of the wedge, before it stalls. Support is at 1220 area, which was just broken out of, followed by 1175.

Monday, December 20, 2010

Singapore Exchange: Back to the drawing board!

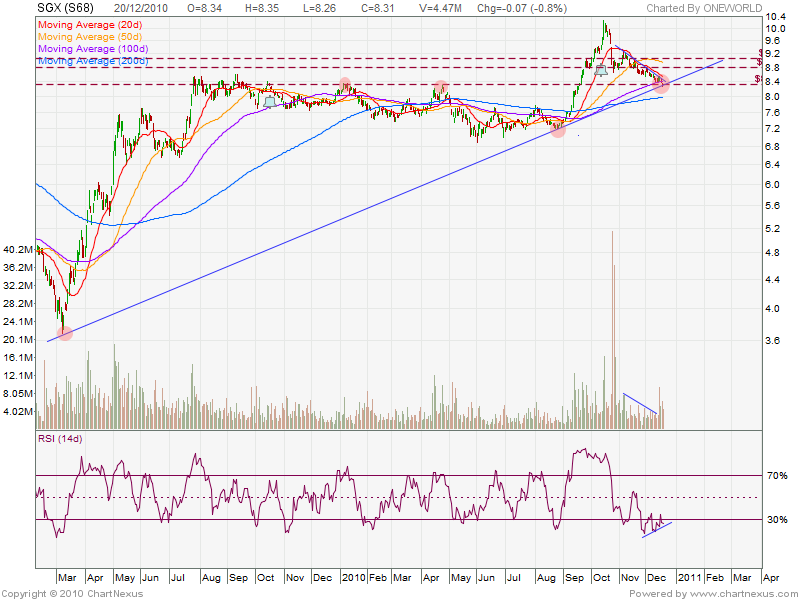
Last post on SGX, suggested a possible bounce as long as price stayed above $8.50. It didn't, and as promised i went back to the drawing board. Here's what i found. SGX is sitting on a trendline going back to the 2009 lows, and is at an important support level around $8.30. With the STI on neckline support at 3120, this is as good a place as any for a rebound. I will wait for the break of the short-term downtrendline, before initiating a trade. Resistance levels as per last post, with $8.50 level as additional one now.


A break below the uptrendline & $8.30 level could be medium-term bearish for SGX. As always, i will have a suitable stop-loss in place. All the best!

Overall, the long-term chart of SGX doesn't suggest strength so far, which leads me to theorize that the merger may not work out eventually! Time will tell, but charts do whisper and occasionally yell. ;)

Sunday, December 19, 2010

Shanghai Composite: Testing Resistance

Since the last update, the SSEC has been barely able to squeak out some gains on low volume, and is now at stiff resistance from the very downtrendline it broke earlier. Coupled with the 2950 historical resistance, we could see a move down lower from here. Initial support around 2700, followed by 2570. On the other hand, a break above the line on decent volume is bullish, and may lead to a re-test of 3150. Based on volume cues so far, the move down seems more likely. Here's the chart:


(Edit: Although the technical reason is clear, watch out for some fundamental explanation from the news agencies to explain the fall!)

All the best!