Saturday, November 20, 2010
S&P500: One more re-test of the highs?
Since the May-10 correction ended in Jul-10, SPX has moved up against an atmosphere of doubt and skepticism, and retested the highs. The rise does look impulsive so far on teh daily chart and seems be tracing out a 4th wave, which implies one more attempt at the highs before a significant correction. Short-term resistance around 1205. Here's the 2-hourly chart, showing a break of the downtrendline.
Wednesday, November 17, 2010
Correlations: $USD vs Commodities, $USD vs Equities
In response to one of my posts on the USD, a fellow investor at this forum rightly pointed out that the inverse correlation between USD and Commodities is stronger than between USD and Equities. Charts of USD vs the CRB & DJ World Indices are shown above. Even then, most USD turning points also turned out to be turning points for equities in the past 3 years. Hence, my view that it is a good idea for an Equity trader to keep an eye on the USD direction as well.
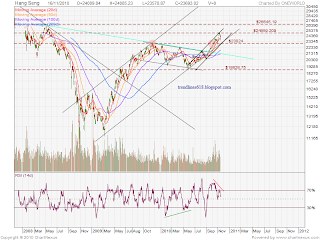
Hang Seng Index: Support at 23000 again
Since the break above 23000, HSI traced out a successful back-test once, before resuming higher towards 25000. An overbought negative divergence created a sharp move lower, coinciding with the dip in the SSEC. Although now oversold on the hourly, the initial support at 22500 did not hold up. Next solid support level is at 23500, with additional help from the rising channel line. A second successful retest might see us range-bound between 23000-25000 for a while, before launching higher towards 27000 area. A break below 23000, will be bearish medium-term.
Tuesday, November 16, 2010
$USD Rockets higher
Last post, "USD Rebound around the corner", suggested that the drop below $76 could be a false break. An initial rebound target of $78 was set. Yesterday, USD took off, breaking above this level, and more critically threatening to break out of the downtrendline. Equities have dipped in response. Resistance from the downtrendline and the $80 level, could see a back-test here. However, a confirmed break above $80, could keep Equities depressed for a while longer.
Shanghai Composite Very Short-Term: Positive Divergence
Here's a 60-min chart of the SSEC. Note the 3-wave decline (so far) from the recent high of 3180. Also note the positive RSI divergence on the latest decline. And coupled with support around the 2850 region, a bounce is likely here in the very short-term towards the 3050 region initially.
Subscribe to:
Comments (Atom)


