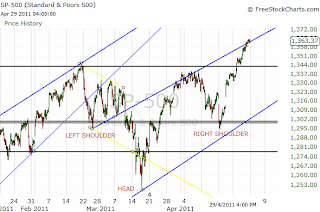
That's a pretty neat-looking Inverse Head & Shoulders (IHS) Pattern on the hourly! Although a IHS pattern is seen more often at bottoms of downtrends, they do occasionally turn up uninvited. A target of 1430 can be calculated based on the chart. Severly overbought on short-term charts, there is a danger of a pull-back, and hence chasing price here would be unwise!
Itching to get LONG?
If you are not long already, wait for a successful back-test of the neck-line, or at least a pull back to wind down the RSIs. That will enable employment of appropriate stop-loss points in the event of a failure.
Significant TOP around 1430
Last update, we talked about dangerous levels of BULLISH sentiment, as a contrarian indicator. Take a look at the weekly chart above. I believe we are approaching a significant top around 1430. There are three reasons to support this proposition:
1. Inverse Head & Shoulders Target level as shown above
2. Serious congestion zone from 2007-2008, just before the wave 3.
3. A Fibonacci 1.38 extention level is reached at this level
All the best!


