Showing posts with label HSI. Show all posts

Sunday, June 19, 2011

Shanghai Breakdown, Hang Seng Update

Shanghai Composite broke down through the bottom line of the big triangle. Although oversold short-term, this is a medium to long-term bearish development. Immediate support is around 2580. We will have to monitor if the break holds over the next week or so, and derive reasonable targets for the downtrend if it develops.


Similarly, Hang Seng has broken below the 22400 level outlined in the earlier post and deteriorated rapidly. Currently oversold with a weak RSI divergence and sitting on the bottom of the channel. Looking for a rebound to test the 22400 level in the short-term

Wednesday, June 8, 2011

Hang Seng Index: Reaching Friendlier Grounds (22,400)

The Hang Seng Blitzkrieg upwards from two weeks ago, met with stiff resistance at the Russian front. Confined to its range, the HSI got beaten back to friendlier territories around 22,400 - a formerly reliable support level. Can it reload and resume it's campaign upwards, or will we see a Normandy-style rout and capitulation? This level is key. With Shanghai starting an oversold bounce, will the HSI follow? Watch the panzer divisions (big hands) for clues.

Thursday, May 26, 2011

Hang Seng Index: Trendline Watch

HSI has stayed in range since the last post, in which a possible breakout was suggested. Respecting 24500 to the upside, while drawing support from 22400. Hence a nice trade will be in play once it breaks either side of this range. In the very short-term, HSI is oversold on the daily with a slight divergence, suggesting a rebound rally of sorts(which has already begun.) Also of interest is the lack of volumes on the recent decline.

Saturday, April 2, 2011

Hang Seng Index: Consolidation before a Breakout?

Since my last post Hang Seng Index: Break Down!, HSI has successfully held support around 22400. Looking at the weekly chart, the index has seen sideways action for the past 5 months, and is reaching the upper trendline resistance yet again, around 24000. We may see some consolidation here. However, the volume patterns suggest that a breakout above is possible in the short-medium term. Intial target will be 25000, followed by the significant pivot of 26300.

Thursday, February 10, 2011

Hang Seng Index: Break Down!

Last post on the HSI showed why we bounced up from 22,400. After a decent advance, the HSI turned down along with other emerging markets, and broke down through the uptrendline. However, as the index is reaching oversold towards the historical 22,400 support, expect a tiny bounce or back-test here. Further support is at 21,800. I will discuss other supports in the event of a further break below this level.


Meanwhile the Shanghai Composite is changing gears, and breaking out of its short-term downtrend. Update to follow shortly.

Thursday, January 6, 2011

Wanton Noodles in New York: HSI & SPX


When in need of a fresh perspective of your city, a stroll towards a little known part of town might help. How about Wanton Noodles(above), a popular Hong Kong dish in China Town, New York?

Here's another very interesting blue(HSI) and red(SPX) noodle dish you might enjoy:

Often times, a HSI-SPX divergence provides a good hint of a short-term reversal in trend. Have a look at the past instances, and the highlighted area. Combine this with the relatively high bullish sentiment, and this DJIA chart from a previous post. What do you think is on offer next for the SPX?

Tuesday, January 4, 2011

Hang Seng Index: Breaks Shoulder Line

Last post on the HSI warned of a possible Head & Shoulders pattern. After a false breakdown, HSI broke above the "shoulder" line in the last session on decent volume. This negates the H&S as explained in the previous post (same applies to STI), and sets up short-term bullish possibilities. However, in the very short-term, stiff resistance exists at 23900, and expect a pullback anytime to test the breakout. A break above this level may re-test recent rally highs.


In the medium-term, am looking for HSI to stay in range (no new rally highs), due to a correlation factor with US indices. I will explain this better in the next few posts.

Meanwhile, SSEC is testing downtrendline resistance, after successfully bouncing above 2700. Will be posting an update within the next few days.

NEW YEAR QUESTION: Why did we bounce on the HSI?

While the fundamental folks are busy coming up with "explanations" for the recent bounce (Chinese factory numbers, commodity prices, ben bernanke's haircut, solar flares, etc etc), here's the real reason for the bounce. Have a look at the weekly HSI chart:


Price simply hit the Uptrendline! Watch that line my friends ;)

Thursday, December 16, 2010

H&S in H&S UPDATE

Refer to my last post: "H&S in H&S?", suggesting an impending Head & Shoulders short-term top in the Hang Seng (HSI) & Straits Times (STI) Indices. Here are the updated charts.

The HSI has given up on 23600 after a bit of a struggle. Note the volume spike on the last decline. As the hourly is oversold - and we're at the neckline -, a short-term bounce is possible here. A break below the neckline on higher volume, will add strength to the H&S picture with an eventual target around below 21000.


The STI seems to be holding up better, and has not yet reached the neckline. Declining volumes are not high either. However, should this change, we're looking at an eventual target around 2900.

A break above the shoulder line will negate these scenarios. Remember, H&S patterns need not always work out. Weigh the probabilities, and place your stops accordingly.

Friday, December 3, 2010

H&S in H&S?

Head & Shoulders in Hang Seng & Straits Times Indicies?

Last post on the Hang Seng, called for a rebound towards 21600 based on the suggested parallel channel. That's exactly what transpired, and the index did a quick about turn as of Friday's close. The Straits Times Index is executing a similar pattern, which has potential for a short-term Head & Shoulders top. However, note that the RSIs are still relatively oversold on the daily chart, and right shoulders not fully formed in symmetry. An eventual move below the necklines, if it does happen, will offer targets just under 21000 on the HSI & around 2910 on the STI. A break above the shoulder line will negate this picture.


Sunday, November 28, 2010

Hang Seng Index V Short Term: Update

Last post on the HSI suggested that an impulsive decline was likely complete, & a Corrective Rebound towards 23600 was due. We did get a whimper of a rebound up to 23275 but failed to close the gap. At the close HSI breached the previous low of 22800, suggesting more downside.

However, there could be support here just under 22700 based on the parallel channel, as suggested on the chart. Also note the very short-term oversold condition. An overlapping & messy rebound towards 23600 is likely to set up the right shoulder of a Head & Shoulders pattern. Look for a break out of the downtrendline in blue, and a break above 22800 as clues.

Tuesday, November 23, 2010

Hang Seng Index, Short Term: An Impulsive Decline

With today's 600-point decline to the 22800 level, HSI has completed what-looks-like a 5-wave decline, or in 'Elliott speak', an Impulsive Decline. It has now reached the most recent support area, and thus a likely point for a Corrective Rebound towards 23600-23800 level, which might materialise in a 3-wave overlapping format. Feel free to browse the Elliott Wave tutorial under 'Education & Resources' if the terms intrigue you. Here's the daily chart:


Head & Shoulders

If the above is indeed a 5-wave decline, principles of Elliott Wave Theory dictate that some form of corrective upward action is due, before another decline to new rally lows. Classical technical analysts might identify this as a potential Head & Shoulders pattern. It's still early days though. A break above 23800, or an immediate break below 22800 will make this less likely.

Other Asian Markets

Other Asian markets (such as the STI) seem to be executing similar patterns too. The SSEC's bullish medium-term picture is in danger of a truncation, after the impressive runup and the deeper-than-expected decline. It might be prudent to take profits on the impending rebound.

All the best!

Wednesday, November 17, 2010

Hang Seng Index: Support at 23000 again

Since the break above 23000, HSI traced out a successful back-test once, before resuming higher towards 25000. An overbought negative divergence created a sharp move lower, coinciding with the dip in the SSEC. Although now oversold on the hourly, the initial support at 22500 did not hold up. Next solid support level is at 23500, with additional help from the rising channel line. A second successful retest might see us range-bound between 23000-25000 for a while, before launching higher towards 27000 area. A break below 23000, will be bearish medium-term.

Friday, November 12, 2010

Shanghai Composite Plunges: Was it the Interest Rates?!


Just google, and you will find a few dozen reasons trying to explain why Chinese stocks plunged over 5% today. The question: Did these websites or analysts help investors GET OUT in time? Nope.

Ok, fine. So did they help investors GET IN, in time for the rally? Here's another 'expert' analyst view in June 2010, with SSEC trading around 2430:


Subsequently SSEC has gone as high as 3180, a 30% gain! So much for expert opinions.


So who knew about the Rally?

Folks who read up a bit of Elliott Wave Theory & basic Technical Analysis, knew with some degree of probability, that a five wave move in one direction is generally followed by a 3 wave move in the opposite direction (most of the time). This was the basis of the bullish call a few months ago on this blog.

And how about the PLUNGE today?

The extent of the decline (a whopping 5%) was not possible to envision, but we sure were setup for a fall. Although i couldn't publish this chart in time, here's three technical observations about the setup (see chart below):

1. Historical Resistance at 3180
2. Overbought with a clear negative divergence on the Daily chart.
3. Overbought on the Weekly chart.(not shown)

And the catalyst (Interest Rate Hike) magically appears at this juncture! For the fundamental folks, this was a classic example of how technicals can help time your investment decisions better.


So what's next?

This move down looks like the back-test of the breakout above the downtrendline. Crucial historical support is also nearby around 2900. If we stay above the line, we may go sideways here for a bit before any attempts higher. I may buy SSEC around the 2900 level, with a Stop at 2850. An unlikely break down here below 2850, changes the picture, and has support at 2700. Watch the volumes on this pullback for clues.

The medium-term target of the previous high of around 3480, still stands for now.

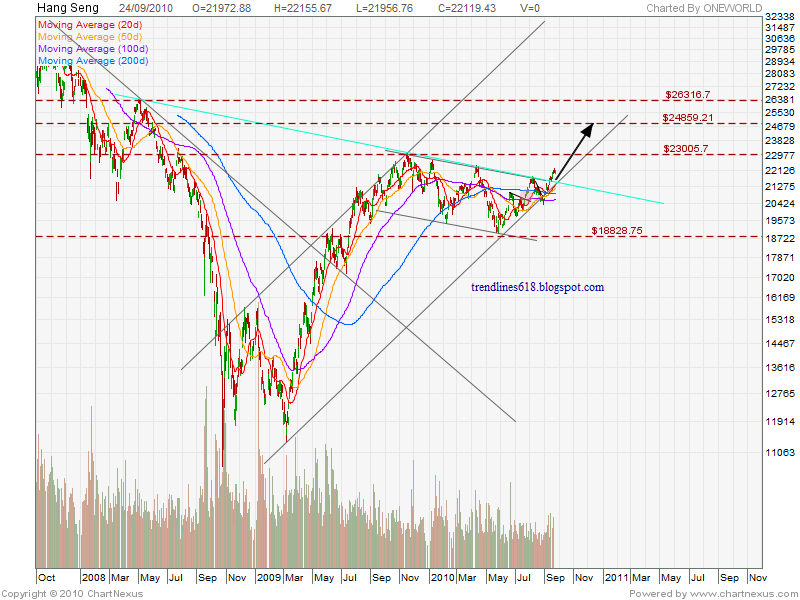
Hang Seng Index - very short term

On a side note, HSI has corrected as well, and seems to be developing a positive divergence on the hourly, indicating potential for a handsome rebound sometime next week.

All the best!

Saturday, October 23, 2010

Hang Seng Index: Support at 23000

HSI has been consolidating its recent rise to new rally highs. Support is at 23000. A successful retest here of the breakout, might see higher levels medium-term, towards the 27000 level.

Thursday, October 7, 2010

Hang Seng: Expect Consolidation Here

Last post on the HSI suggested 23000 as the first stop, in this medium-term bullish breakout. We're there now, and also at the top of the channel as shown. Expect a back-test of the breakout here, or at least a sideways consolidation over the next few weeks, before any further upside. A sustained break above 23000 right now might turn it into a strong support level instead.

Saturday, September 25, 2010

Hang Seng Index Bullish Breakout

Hang Seng Index broke above a significant downtrendline as indicated in previous posts. Due for a backtest of the breakout in the short-term, which if successful, points towards a bullish medium-term outlook. Immediate resistance is previous high of 23000. Further upside levels are indicated on the chart.

Wednesday, August 25, 2010

MSCI Emerging Markets & HSI: Trendline Break

MSCI Emerging Markets Index looks like it has completed a B wave up, and is probably setup for an impulsive C decline over the next couple of months. Strong support in the 900-910 area, a failure of which will open the door to 825-830 region, to end the correction.
On a related note, Hang Seng Index (HSI) has broken its short-term uptrendline and may be headed lower to the 19800 region initially. Further supports at 19400 and 19000. In the very short-term, a rebound is possible to re-test the trendline break.

All the best!

Friday, August 6, 2010

Hang Seng Index: Consolidation, followed by break higher

My last post, "Resuming Upwards", called for a move up to the upper channel line. HSI did precisely that, and is now very overbought around 21700. Looking for some consolidation here, before a possible break higher to eventually target 26,400.


Initial Target & Supports

On a break above the upper channel line, initial target will be around 23000, followed potentially by 24600 & 26400. Support is now 21000. A sustained move below this level - although unlikely - will change the picture to bearish.

All the best folks!

Sunday, July 25, 2010

Hang Seng Index Very Short-Term: Resuming Upwards

Since the bounce off the lower parallel channel, HSI went vertical and then consolidated in a 1000-point range. In the last session, price gapped above the congestion, setting up a resumption of the move upwards for the very short-term. Have a look at the closeup of the HSI daily chart.


We can expect a move towards 21000 initially, then stiff resistance around 21500 (or where the upper trendline is). An eventual break above the upper channel line, will result in a medium-term bullish setup.

Refer to this last post for the big picture. Meanwhile, Shanghai is on track towards 2700, with a stumble or two at 2600.

Friday, July 23, 2010

Video: The Real-Time Power of Elliott Wave Analysis

Mainstream financial analysts always look for ways to explain market action through news stories and events. Conventional wisdom states that news and inter-market correlations cause market booms and busts, but such explanations rely on selective presentation of the data. In this video, Elliott Wave International's Asian-Pacific Financial Forecast Editor Mark Galasiewski shows you how Elliott wave analysis was able to predict Hong Kong's late '90s mania and its aftermath in real time -- without looking at the news or the market's "fundamentals."


Watch More about the Power of Elliott Wave Analysis in this FREE Video

Discover how Elliott wave analysis gives you a consistently logical explanation
-- and debunk one of the major myths of what caused the Asian Financial Crisis
-- in the free video, "The Real-Time Power of Elliott Wave Analysis:
Debunking the Myths of the Asian Financial Crisis
." Access Your FREE Video Now.